Improve your Logseq notes with MermaidJS diagrams
One picture is worth a thousand words. Especially when you want to capture complex relationships between concepts or systems. That’s why I love using MermaidJS for drawing diagrams.

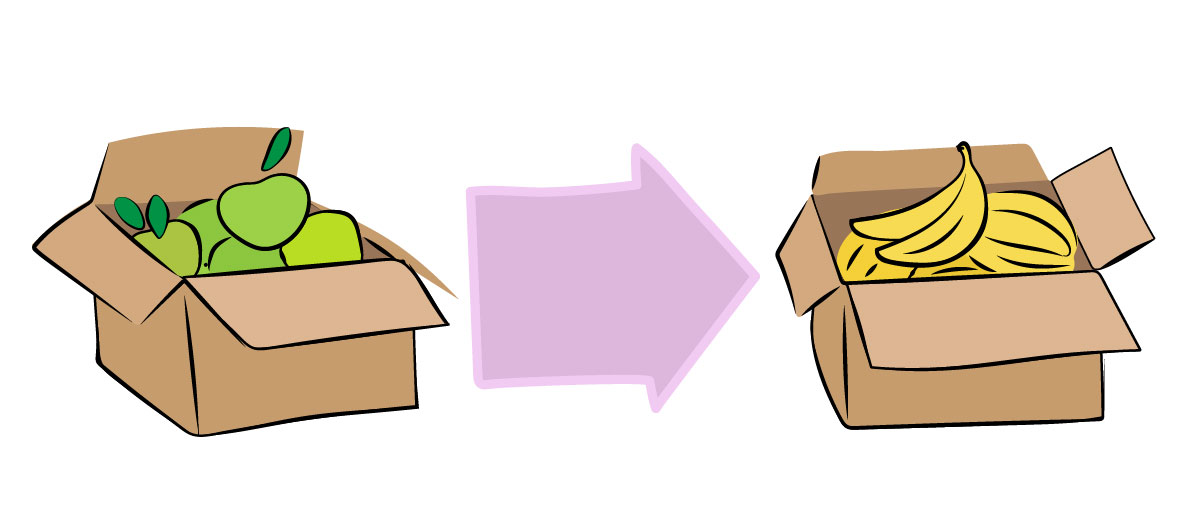
“Apples to Bananas” by Ljubica Petkovic
The new Logseq extension “Fenced Code plus” now renders Mermaid diagrams, so it’s a good time for me to show you how to use MermaidJS with Logseq so you can quickly create diagrams only using your keyboard.
If you haven’t used Logseq before, it’s the best notetaking app I’ve ever used. You can check my Zettelkasten note-taking after one year post, where I explain why I like it so much. Or you can go directly to the Logseq website and try the Live Demo.
So, you are sold, and you’ve installed Logseq? Let’s create some diagrams! First, install the Fenced Code Plus plugin by opening Logseq and clicking the three little dots in the top-right corner and selecting “Plugins”. Then search for “Fenced Code Plus”.
Now we are ready to start with some diagrams. Type the following code in your Logseq:
```mermaid
graph LR
Apples --> Bannana
```
And you’ll see:
Pretty neat, isn’t it? Let’s go through the elements of the code snippet:
mermaid- this will mark the code block as MermaidJS chart so the Fenced Code Plus plugin can render itgraph LR- this tells Mermaid to render the most common type of diagram, Flowchart. Flowcharts are the best for quickly capturing relationships between concepts. TheLRstands for left-to-right (the direction of the diagram).Apples --> Banana- We’ll draw two boxes (called nodes) and an arrow between them
You can see that with four lines of code, we could draw a simple diagram. With a little bit of practice, it will be easier for you to “code” a diagram rather than use Excalidraw1 or diagrams.net.
More advanced Flowchart
The Flowchart is the most intuitive and common MermaidJS chart, and I will explain a few more concepts to help you create better charts.
Paste the following snippet to your Logseq:
```mermaid
graph TB
subgraph Fruit
A[Green Apples] --"are more sour than"--> B[Bananas]
end
B --"goes to"--> C(Banana milk shake)
B --"goes to" --> D(Musli)
D -.-> Sn1[Snack]
A -.-> Sn1
```
When you see the rendered chart, you can roughly understand what parts in the code snippet are responsible for certain nodes and arrows.
This chart is a more advanced version of the previous one. These are the new elements we used:
graph TB- we changed the direction of the chart to beTB(top-to-bottom)A,B,C,D, andSn1- These are node identifiers. We used multi-word labels for nodes, and so we had to introduce identifiers. Node identifier can be any sequence of alphanumerical characters (except for reserved words likeendandgraph)- The neat thing is that you add the label only once. When Mermaid sees
B[Bananas], it remembers that B has sharp corners and text Banana, and you can refer to this node asBin the rest of your code.
- The neat thing is that you add the label only once. When Mermaid sees
[]and()- Using square and round brackets around labels will render sharp and rounded corners on the node.--"label"-->- We added a label to the arrows between nodes.-.->- We used dotted arrows.subgraph <name> ... end- We marked apples and bananas as fruit with a highlighting rectangle calledsubgraph. All nodes whose names appear in the section betweensubgraphandendwill be highlighted with a rectangle in the chart.
If you are not sold on the idea of writing code to create charts, or you don’t want to install a plugin to your Logseq just yet, give Mermaid a go in their Live Editor, you can look at the Mermaid documentation for reference.
The Flowchart diagram I showed you is only one of ten available types of diagrams, but it is the one I used by far the most. If you learn the syntax I explained in this post, you’ll be able to explain complex relationships with MermaidJS graphs.
-
Excalidraw is already part of Logseq, and you can add a drawing by typing in
/Draw↩︎